

Maximizing Code Quality: A Guide to Achieving Code Coverage with JaCoCo in Spring Boot Applications


Code coverage is an important metric in software development because it helps you understand how thoroughly your code has been tested be in a Unit or Integrated test in your environments.
There are a lot of code coverage tools available, but today we have to look at Jacoco.
JaCoCo, which stands for Java Code Coverage, is an open-source code coverage tool for the Java programming language. It is used to measure and report how much of your Java code is executed during the execution of your tests or your business code in environments.
Jacoco code coverage can be achieved via different ways like Maven Plugin for your Unit tests. Today we are going to see how to use the Jacoco Java agent to instrument code deployed in one of the DEV, UAT, or PROD environments. This blog demonstrated that it is environment-agnostic and can be applied anywhere.
JaCoCo uses class file instrumentation to record execution coverage data. Class files are instrumented on the fly using a so-called Java agent. This mechanism allows in-memory pre-processing of all class files during class loading independent of the application framework.
Pre-requisite
Sample Java Project. (We will be bootstrapping the Spring Boot project.)
JDK17 (Anything above JDK5 should work.)
Maven (For dependency management, optional.)
IDE of your choice. (We are using Spring Tool Suite.)
JACOCO Agent
The JaCoCo agent collects execution information and dumps it on request or when the JVM exits.
There are three different modes for the execution of data output:
File System: At JVM termination execution data is written to a local file.
TCP Socket Server: External tools can connect to the JVM and retrieve execution data over the socket connection. Optional execution data reset and execution data dump on VM exit is possible.
TCP Socket Client: At startup the JaCoCo agent connects to a given TCP endpoint. Execution data is written to the socket connection on request. Optional execution data reset and execution data dump on VM exit is possible.
We will be using the File System mechanism for our demo purposes.
JACOCO CLI
JaCoCo comes with a command line interface to perform basic operations from the command line. The command line tools with all dependencies are packaged in jacococli.jar and are available with the JaCoCo download.
Java 1.5 or greater is required for execution. We will use this CLI to generate HTML reports which will show code coverage for our Java project.
Download Jacoco Agent and CLI
We will download the latest(v0.8.10 at the time of blog) jacoco agent distribution file (jacoco-0.8.10.zip) from here, extract it, and keep it handy at the location of your choice.

Bootstrap Spring Boot Application
We will bootstrap a simple Spring Boot application using Spring IO Initialzr as below, we will only Spring Web dependency for HTTP Controller purposes.
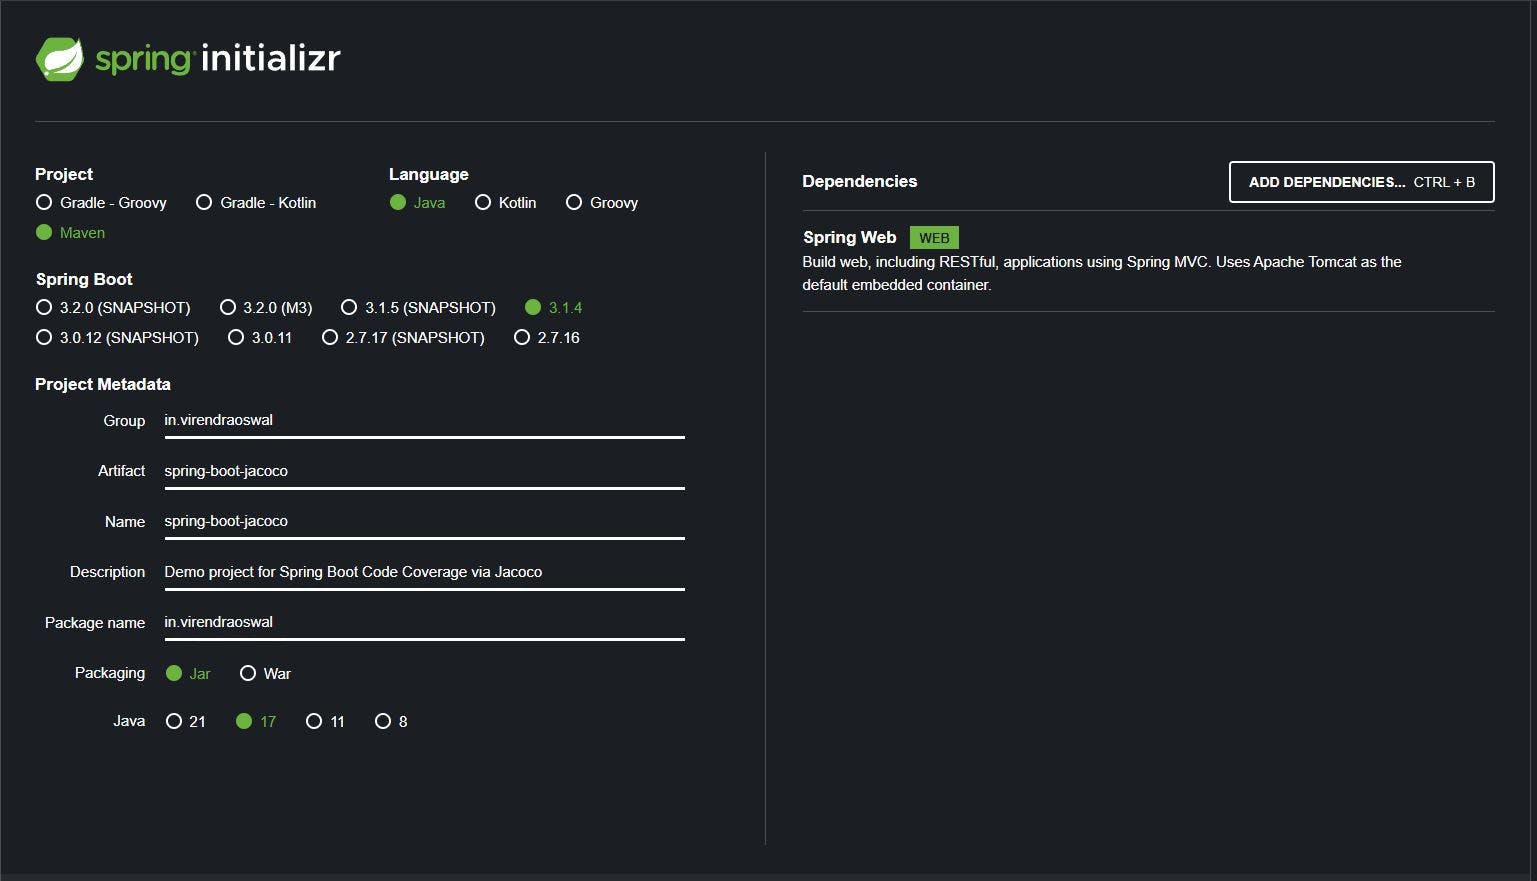
We will add one Controller and one Service with some branching code to demonstrate Missed instruction and branches.
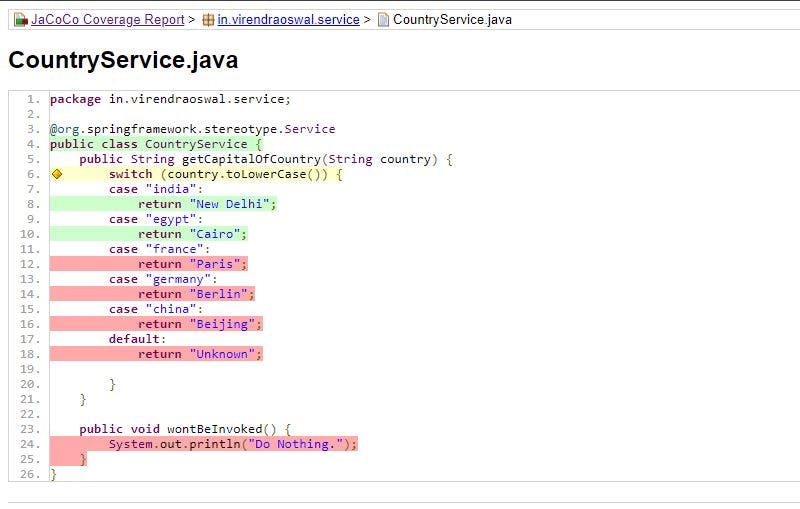
Our Service will basically have 2 methods
getCapitalOfCountry: This basically returns Capital for a given country

wontBeInvoked: This will be a method that won't be invoked at all, so it will be highlighted under the missed method metric in jacoco.

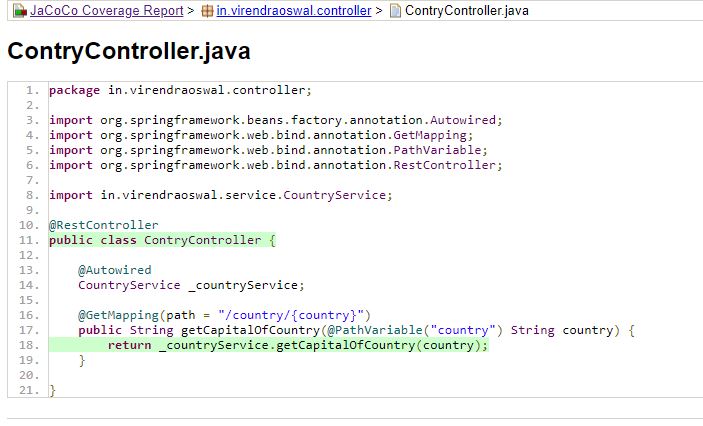
We will have just one URI resource in the controller class as below, which will invoke the Service Method of getCapitalOfCountry
@RestController
public class ContryController {

    @Autowired
    CountryService _countryService;

    @GetMapping(path = "/country/{country}")
    public String getCapitalOfCountry(@PathVariable("country") String country) {
        return _countryService.getCapitalOfCountry(country);
    }
}
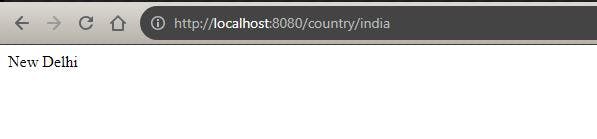
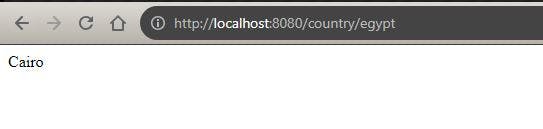
Voila, we will quickly test the code to verify all good. We will hit endpoints for dummy country capital data being set up.


We look good from the HTTP endpoint view.
Jacoco Agent Integration
Attach Jacoco Agent
Now we have our Java application ready, in our Spring Boot application. We will now integrate the Jacoco agent so it can start recording and instrumenting code when we perform tests again.
It's pretty simple, we just have to pass Java Options to attach the Java agent. If you are using some Java command directly to execute your process you can export JAVA_OPTS.
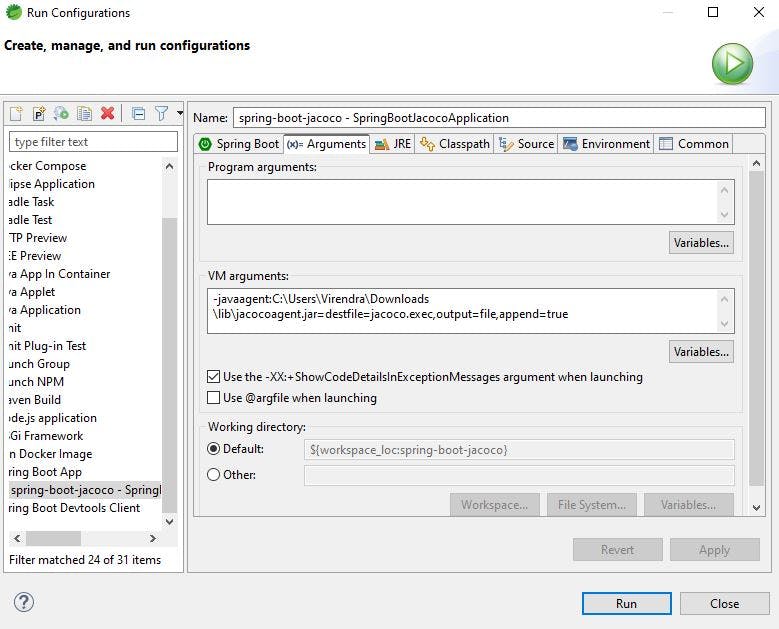
In our case we are going to pass as VM Arguments to our STS Tool(Eclipse wrapper) run configuration, but command remains same.
-javaagent:C:\Users\Virendra\Downloads\lib\jacocoagent.jar=destfile=jacoco.exec,output=file,append=true
So basically we attach the agent with the required location of jacocoagent.jar, the destination file where execution data instrumented should be outputted, and the type of output which is a file in our case as mentioned earlier. Append true specifies new data will get append after multiple reboots to the same execution file generated.
More details about different parameters can be found here.
Now we have attached the agent and passed as VM arguments as below
We will now start the application and hit the endpoint of our to get the capital of the country for only 2 below countries: India and Egypt so we show differences in coverage before we shut down the application.
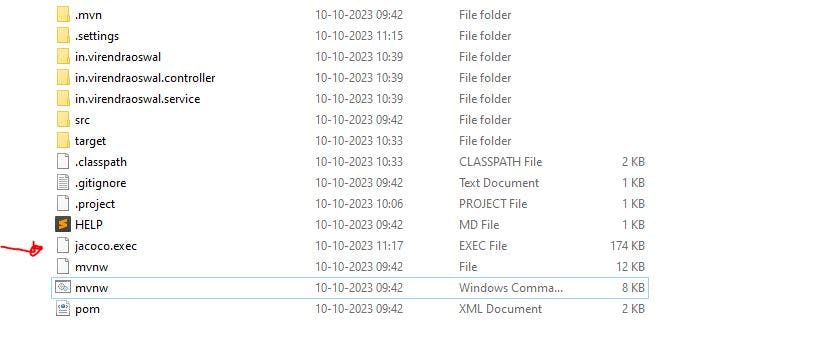
We will now shut down the application. As soon as we shut down the application, we will see jacoco.exec created in our project root directory. (The path for destfile can be anything, if not it will be the root of the project.)
Now that our Jacoco file contains all our execution data, we will now use CLI which came bundled with the same Jacoco Agent distribution file to get code coverage details in HTML form.
Generating Code Coverage Report via Jacoco CLI
We will use the below command via Jacoco CLI to get a code coverage report for our execution data.
java -jar C:\Users\\Virendra\\Downloads\\lib\\jacococli.jar report jacoco.exec --sourcefiles src\\main\\java --classfiles target\\classes\\in\\virendraoswal --html .
So command is pretty self-explanatory.
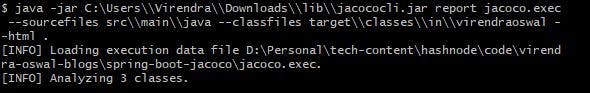
We execute CLI jar providing a path to source files, class files, where report or execution data file a.k.a jacoco.exec generated in the last step and format of code coverage output file.
There are other parameters for CLI which can be found here.
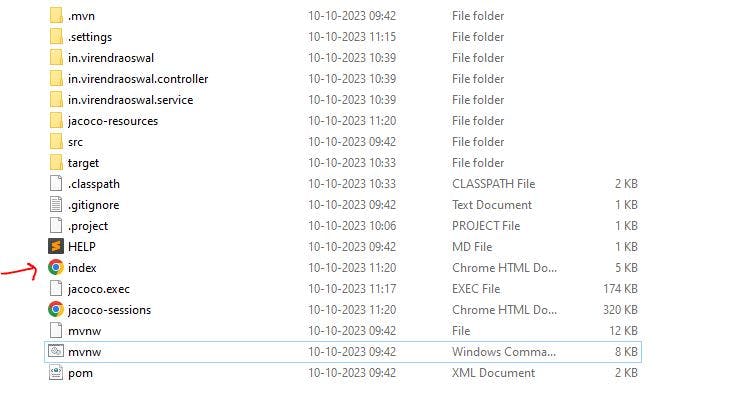
Once we execute the above command, we see index.html created in the same root directory which has all code coverage reports.
Jacoco Code Coverage Report
If you now open index.html generated, it will show all packages and classes being instrumented. We won't go into deep details about each metric, but details for the same can be found here.
If you see CountryController class, it has 100% coverage. Because we have only one API resource which was called at least once

However, if we see CountryService we have less coverage on instruction as well as a branch because not all code was executed and not all branches within getCapitalOfCountry were executed.
We can also see 1 Method missed as per the report as it was never invoked a.k.a wontBeInvoked.

Voila, this helps to know what part of the code is executed and what is not. With this, we can improve code maintainability, and remove redundant code which will directly help with the Heap Memory footprint of the application too.
This was just a basic integration of Jacoco with your Java application that helps developers measure and improve the quality of their Java code by providing insights into how thoroughly the code is tested.
Resources
Thank you for reading, If you have reached it so far, please like the article, It will encourage me to write more such articles. Do share your valuable suggestions, I appreciate your honest feedback and suggestions!