


Optimizing Spring Boot Application Startup Time
Unlocking Performance: Strategies, Tools, and Best Practices for Analyzing and Enhancing Spring Boot Application Startup Times


Analyzing the startup time of a Spring Boot application is important for several reasons, and it can have a significant impact on the overall performance and user experience of the application.
Here are some key reasons why startup time analysis is crucial
Scalability: Quick startups are essential for efficient scaling.
Resource Utilization: Slow startups may lead to inefficient resource use.
DevOps and CI/CD: Fast startups facilitate rapid development and deployment.
Diagnostics: Helps identify bottlenecks and issues early in development.
Containerization: Quick startups are vital for containerized environments.
Cold vs. Hot Starts: Understanding and optimizing both scenarios.
Framework Loading: Identifying components impacting startup time.
Optimization: Opportunities to improve overall efficiency and performance.
Today we will look at one of the open source libraries named Spring Boot Startup Report which was created by Maciej Walkowiak.
Spring Boot Startup Report library generates an interactive Spring Boot application startup report that lets you understand what contributes to the application startup time and perhaps helps to optimize it.
It gives startup runtime report (HTML page), Flame charts, Search features on certain class or annotations. It works with integration tests too.
Prerequisites
JDK 8+
Spring Boot 2.7+ or 3.0+
Integration into Spring Boot Apps
To demonstrate quickly, we will just bootstrap a spring boot app with Web dependency as below.

Extract and Import into the IDE of your choice.
We will create 2 Dummy Services and inject them into a Dummy Controller as below
@Service
public class DummyServiceOne {
}
@Service
public class DummyServiceTwo {
}
@RestController
public class DummyController {

    @Autowired
    DummyServiceOne _serviceOne;

    @Autowired
    DummyServiceTwo _serviceTwo;

}
Now we will add Spring Boot Startup Report maven dependency into our project as below
<dependency>
    <groupId>com.maciejwalkowiak.spring</groupId>
    <artifactId>spring-boot-startup-report</artifactId>
    <version>0.2.0</version>
    <optional>true</optional>
</dependency>
We will just run the Vanilla flow of our application, and visit /startup-report URI on our application in our case is http://localhost:8080/startup-report
We can search for our Dummy classes by filtering out using dummy keywords.
We can see the report below, this report doesn't really show anything in terms of duration as we have literally nothing in our classes.
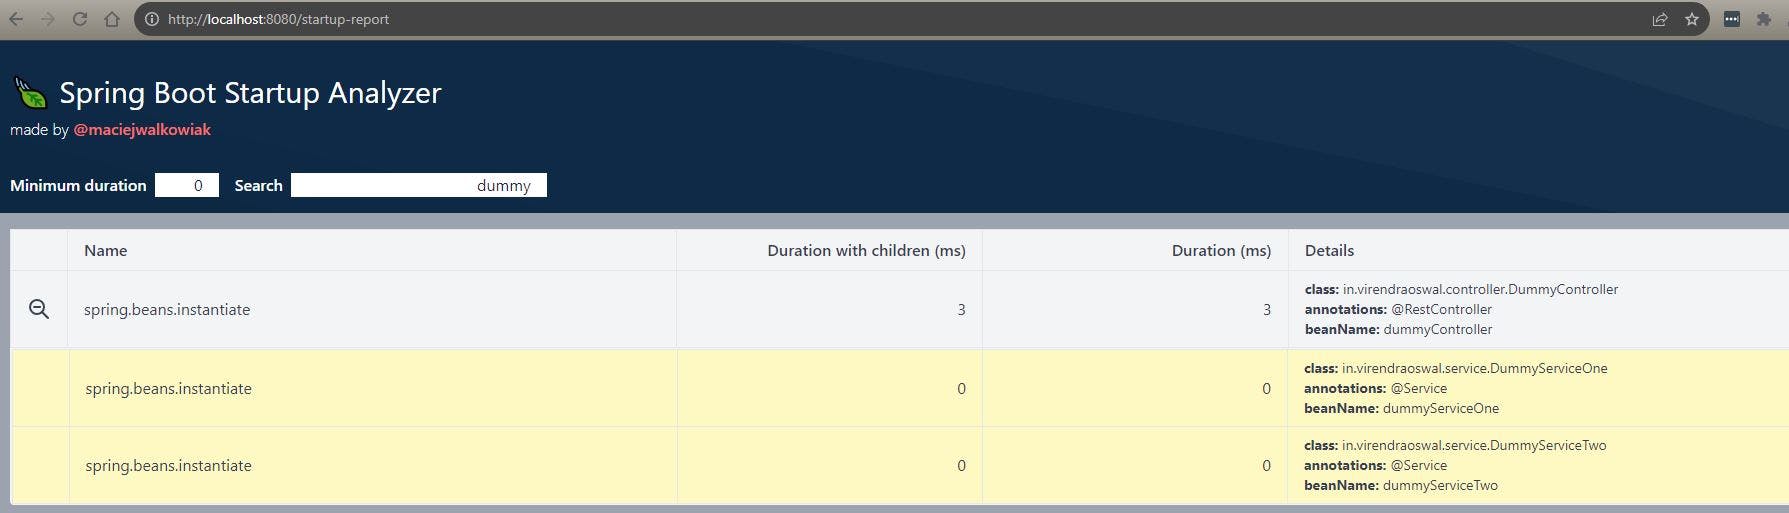
But we can have Duration with Children and Duration in milliseconds which shows the time taken by injected Bean dependencies and Bean Instantiation itself, for example, ServiceOne and ServiceTwo are children of Controller in our case.
Now to show duration we will add some Thread Sleeps in our Class definition as below few via Constructor and one via Spring Lifecycle method @PostConstruct.
The controller will simulate to show it takes 2 seconds to construct, Service One around 4 seconds whereas Service Two around 3 seconds.
We will update our classes below
import org.springframework.stereotype.Service;

import jakarta.annotation.PostConstruct;

@Service
public class DummyServiceOne {

    @PostConstruct
    void setup() {
        try {
            Thread.sleep(4000);
        } catch (InterruptedException e) {
            e.printStackTrace();
        }
    }

}
import org.springframework.stereotype.Service;

@Service
public class DummyServiceTwo {

    public DummyServiceTwo() {
        try {
            Thread.sleep(3000);
        } catch (InterruptedException e) {
            e.printStackTrace();
        }
    }
}
@RestController
public class DummyController {

    @Autowired
    DummyServiceOne _serviceOne;

    @Autowired
    DummyServiceTwo _serviceTwo;

    public DummyController() {
        try {
            Thread.sleep(2000);
        } catch (InterruptedException e) {
            e.printStackTrace();
        }
    }

}
One thing you quickly notice is Startup times have increased to around 10 seconds.

Now if we revisit our Startup Report URI again we can clearly see Controller along with Childreen took 9 seconds, whereas itself it took 2 seconds as per Thread Sleep.

ServiceOne and ServiceTwo duration took respective Thread Sleep times of around 4 seconds and 3 seconds.
Voila, so easy to integrate and capture Spring Beans which takes a lot of time as part of Spring Boot Startup times which can help with a lot of things listed above.
Resources
Thank you for reading, If you have reached it so far, please like the article, It will encourage me to write more such articles. Do share your valuable suggestions, I appreciate your honest feedback and suggestions!